Multiple Choice
Identify the
choice that best completes the statement or answers the question.
|
|
|
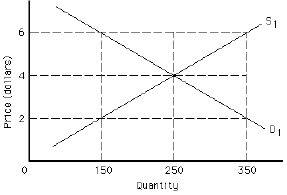
Exhibit 3-1
|
|
|
1.
|
Refer to Exhibit 3-1. Equilibrium price and quantity are
a. | $2 and 250 units. | b. | $4 and 150 units. | c. | $2 and 150
units. | d. | $6 and 250 units. | e. | none of the
above |
|
|
|
2.
|
Refer to Exhibit 3-1. If the market price were $2, the shortage would
equal
a. | 350 units. | b. | 200 units. | c. | 150
units. | d. | There is no shortage at $2. |
|
|
|
3.
|
Refer to Exhibit 3-1. In the past, the government decided that the number of
producers in this market was growing too fast and that the producers were engaging in “wasteful
overproduction”. So, the government created a quota-and-licensing system that licensed
the existing producers and limited them to a total market production of 150 units. The graph
represents supply and demand today. The price and quantity sold, given today’s supply,
demand, and the government’s quota, is
a. | $2 and 250 units. | b. | $4 and 150 units. | c. | $2 and 150
units. | d. | $6 and 150 units. | e. | none of the
above |
|
|
|
4.
|
Refer to Exhibit 3-1. In the past, the government decided that the number of
producers in this market was growing too fast and that the producers were engaging in “wasteful
overproduction”. So, the government created a quota-and-licensing system that licensed
the existing producers and limited them to a total market production of 150 units. The graph
represents supply and demand today. The effect of the quota on producers is that today they
sell each unit for
a. | $6, which is the minimum they are willing to accept for this
quantity. | b. | $4, which is the minimum they are willing to accept for this
quantity. | c. | $2, which is the minimum they are willing to accept for this
quantity. | d. | $6, which is $4 above the minimum they are willing to accept and results in extra
profits. | e. | $4, which is $2 above the minimum they are willing to accept and results in extra
profits. |
|
|
|
|
|
|
5.
|
Refer to Exhibit 3-1. A shift from demand curve D to D' illustrates
a(n)
a. | decrease in demand | b. | decrease in quantity
demanded | c. | increase in quantity demanded | d. | increase in demand | e. | increase in
supply |
|
|
|
6.
|
Refer to Exhibit 3-1. The shift in the market demand curve from D to
D' could have been the result of
a. | an increase in the price of a complement good | b. | a decrease in
income(s) | c. | an improvement in the techonology for producing this good | d. | an increase in the
number of consumers in this market | e. | the good no longer being perceived as useful or
fashionable by consumers |
|
|
|
7.
|
A price ceiling set below the equilibrium price will result in a
shortage.
|
|
|
8.
|
Which of the following is correct when a price floor is set above the
equilibrium price?
a. | quantity supplied is less than quantity demanded at the set price | b. | quantity supplied is
equal to quantity demanded at the set price | c. | at the set price there will be a
shortage | d. | The market price is greater than the price floor | e. | quantity supplied
exceeds quantity demanded at the set price |
|
|
|
9.
|
If the minimum wage law sets a wage floor above the equilibrium wage in the
unskilled labor market,
a. | the minimum wage will create a surplus of labor. | b. | the minimum wage
will create a shortage of labor. | c. | the minimum wage will not affect the labor
market. | d. | the labor market will change, but we cannot be certain
how. |
|
|
|
10.
|
Suppose the current equilibrium price of pizza is $5. If the government decides
the price of pizza cannot rise above $4, the result of this policy would be
a. | a shortage | b. | a surplus | c. | that the market
would remain in equilibrium but with a larger quantity bought and sold than at $5 | d. | at the $4 price, the
quantity sold would be greater than the quantity bought | e. | a shift of demand to
the right |
|
|
|
11.
|
If the government imposes a ceiling price on apartment rents, we would expect to
observe all of the following except one. Which is the exception?
a. | an increase in the number of new apartment complexes being built | b. | long waiting lists
for apartment seekers | c. | lower maintenance of existing
apartments | d. | conversion of some apartment complexes to condos | e. | a
shortage |
|
|
|
|
|
|
12.
|
Exhibit 0026 depicts the milk market. The horizontal line, P, represents a price
ceiling imposed by the government. Which of the following is true?
a. | At equilibrium, the quantity demanded is 800 gallons. | b. | At the price
ceiling, there is a surplus. | c. | The quantity demanded at the price ceiling will
equal the quantity supplied. | d. | The equilibrium price would be $1 without the
price ceiling. | e. | The quantity supplied at the price ceiling will be the quantity
sold. |
|
|
|
13.
|
Exhibit 0026 depicts the milk market. The horizontal line, P, represents a price
ceiling imposed by the government. Which of the following is true?
a. | At equilibrium (ignoring the ceiling) the quantity demanded is 700
gallons. | b. | At the price ceiling, there is a surplus. | c. | The quantity
demanded at the price ceiling will equal the quantity supplied. | d. | The equilibrium
price would be $1 without the price ceiling. | e. | The quantity supplied at the price ceiling will
equal the quantity demanded. |
|
|
|
14.
|
In Exhibit 0026, which of the following is true at the price ceiling, P?
a. | The excess quantity supplied equals 300 gallons. | b. | The excess quantity
demanded equals 300 gallons. | c. | The excess quantity supplied equals 500
gallons. | d. | The excess quantity demanded equals 800 gallons. | e. | Sales will be equal
to 800 gallons. |
|
|
|
15.
|
Suppose a market is in equilibrium and then a price ceiling is established below
the equilibrium price. Which of the following will happen?
a. | quantity demanded will decrease | b. | a surplus will develop | c. | a shortage will
develop | d. | the quantity sold will rise | e. | the market will remain in
equilibrium |
|
|
|
16.
|
If a quota is established in a market and has an effect, then compared to the
equilibrium,
a. | price will be higher and quantity lower | b. | the license or
right-to-produce will itself be valuable | c. | the producers will earn extra
profits | d. | consumers will have to get by with a lesser amount produced | e. | all of the
above |
|
|
|
17.
|
If an increase in income results in an increase in the demand for eggs,
then
eggs are
a. | a discretionary good. | b. | a luxury good. | c. | a normal
good. | d. | an essential good. |
|
|
|
18.
|
Which of the following is the best example of complements?
a. | milk and water | b. | coffee and tea | c. | rice and
potatoes | d. | hiking boots and athletic shoes | e. | tortilla chips and
salsa |
|
|
|
19.
|
Which of the following is most likely to be an inferior good?
a. | airline travel | b. | restaurant meals | c. | a subscription to
the Wall Street Journal | d. | soft drinks | e. | used
clothing |
|
|
|
20.
|
A demand curve shows how quantity demanded changes with price. This implies
that
a. | only price shifts a demand curve | b. | everything else that affects demand is held
constant | c. | quantity demanded is unrelated to price | d. | economists are
concerned only with money | e. | it is impossible to show how anything but price
affects demand |
|
|
|
21.
|
Movements along a demand curve are called changes in
a. | demand | b. | opportunity costs | c. | quantity
demanded | d. | the substitution effect | e. | preferences |
|
|
|
|
|
|
22.
|
Figure 2.1 shows the market for MP3 players.
According to this diagram, what is the quantity demanded for MP3 players if the price of MP3 players
is $300?
a. | 1 thousand | b. | 2 thousand | c. | 3
thousand | d. | 4 thousand |
|
|
|
23.
|
If the price of a good rises, producers are likely
to
a. | devote more resources to producing the product since it
will be more profitable to do so. | b. | be willing to sell
less of the good. | c. | be
unaffected. | d. | All of the
above |
|
|
|
|
|
|
24.
|
Figure 2.5 shows the market for beef.
According to the diagram, how many pounds of beef will be sold at equilibrium?
a. | 4 thousand | b. | 3 thousand | c. | 2
thousand | d. | 1 thousand |
|
|
|
25.
|
Figure 2.5 shows the market for beef. If the
price of beef is $3.00,
a. | This will lead to a shortage of
beef. | b. | The quantity of beef demanded will exceed the quantity
supplied. | c. | An increase in the demand for
beef. | d. | The price will eventually fall because the sellers want
to sell more beef than the buyers are willing to buy at this
price. |
|
|
|
26.
|
The equilibrium point represents the only price-quantity combination in a market
that
a. | causes both buyers and sellers to agree to a price increase | b. | causes both buyers
and sellers to agree to a price decrease | c. | exactly matches the independent plans of buyers
and sellers | d. | allows buyers to purchase what they want | e. | allows sellers to
earn a profit |
|
|
|
27.
|
When a market is in equilibrium,
a. | producers earn profits | b. | the minimum possible price is
achieved | c. | there is no incentive for consumers or producers to change their current
behavior | d. | excess demand is less than excess supply | e. | the maximum possible
price is achieved |
|
|
|
|
|
|
28.
|
If the price of the good described in Exhibit 0023 is $1.20, then there is
a
a. | shortage of 30 units | b. | surplus of 30 units | c. | shortage of 60
units | d. | surplus of 60 units | e. | surplus of 20
units |
|
|
|
29.
|
If the price of the good described in Exhibit 0023 is $1.60, then there is
a
a. | shortage of 30 units | b. | surplus of 30 units | c. | shortage of 20
units | d. | surplus of 20 units | e. | surplus of 10
units |
|
|
|
30.
|
If the price of a good is lower than the equilibrium price, this leads
to:
a. | A shortage | b. | A surplus. | c. | Excess
supply | d. | Both b) and c) |
|
|
|
31.
|
The ability of markets to move toward a new equilibrium following a disturbance
is an example of economic coordination through
a. | Central planning | b. | Government policy | c. | Spontaneous order
created by market forces. | d. | Price floor. |
|
|
|
32.
|
Which of the following would cause both the equilibrium price and equilibrium
quantity of cookies to decrease? (hint: first determine whether a shift in demand or a shift in
supply would lower price AND quantity)
a. | a rise in the price of milk (a complement) | b. | a rise in consumer
incomes | c. | a rise in the price of cookie dough | d. | a drop in the price of cookie
dough | e. | a rise in the price of crackers (a substitute) |
|
|
|
33.
|
Attempts are being made to develop a biodegradable plastic using agricultural
produce such as potatoes. If these attempts are successful, what will happen to the equilibrium price
and quantity of potatoes?
a. | Price will increase and quantity decrease. | b. | Price will increase
and quantity increase. | c. | Price will decrease and quantity
increase. | d. | Price will decrease and quantity decrease. | e. | No change in
equilibrium price and quantity will occur. |
|
|
|
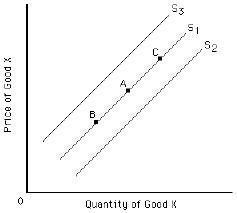
Exhibit 3-7
|
|
|
34.
|
Refer to Exhibit 3-7. A decrease in the price of a resource that is necessary
for the production of good X causes
a. | the supply of good X to shift from S1 to S2. | b. | the supply of good X
to shift from S1 to S3. | c. | a movement along S1 from point A to point
B. | d. | a movement along S1 from point A to point C. | e. | no change in the
supply of good X. |
|